If you’ve ever wondered what recruitment metrics to look at to make data-driven decisions about your recruiting process and people, this one’s for you. This is the story of how we started using data and metrics to boost our recruitment efforts, and what we’re tracking and improving each day.
At The Predictive Index®, we move fast, and we use data to help us make decisions at all levels. When our CEO, Mike Zani, said (at an all-company meeting), “You can’t run a successful organization on anecdotes,” our people operations team started wondering:
“What could we be doing to take our recruiting and people processes to the next level?”
Before I knew it, I was on a plane to Utah to learn the ins and outs of Domo, a data visualization tool. Domo allows our team to get a bird’s eye view of our recruitment funnel so we can make data-driven decisions—rather than running our function on anecdotes.
Tracking recruitment metrics with Domo
Domo lets us get as granular as we like; we drill down on recruitment metrics including time to hire, quality of hire, candidate experience, etc.
“Measuring what matters” is the first activity of talent optimization. By collecting, measuring, analyzing, and acting on our data, we’ve improved the experience for our job seekers—and also our offer acceptance rate.
Let’s explore two of the recruitment metrics we track at PI:
1. Candidate experience
On the recruitment team, our top priority is giving each candidate who comes through the pipeline a “white-glove” experience. This is why we started tracking the candidate experience metric.
We set up a survey that automatically goes out to anyone who joins us onsite for a Super Day (our version of the in-person interview). The anonymous survey poses nine questions about the candidate’s experience. We pull responses into Domo to visualize candidate sentiment.
As you can see (below), of 49 candidates, 79.5% had a positive experience. But what about those who had a neutral or negative experience?
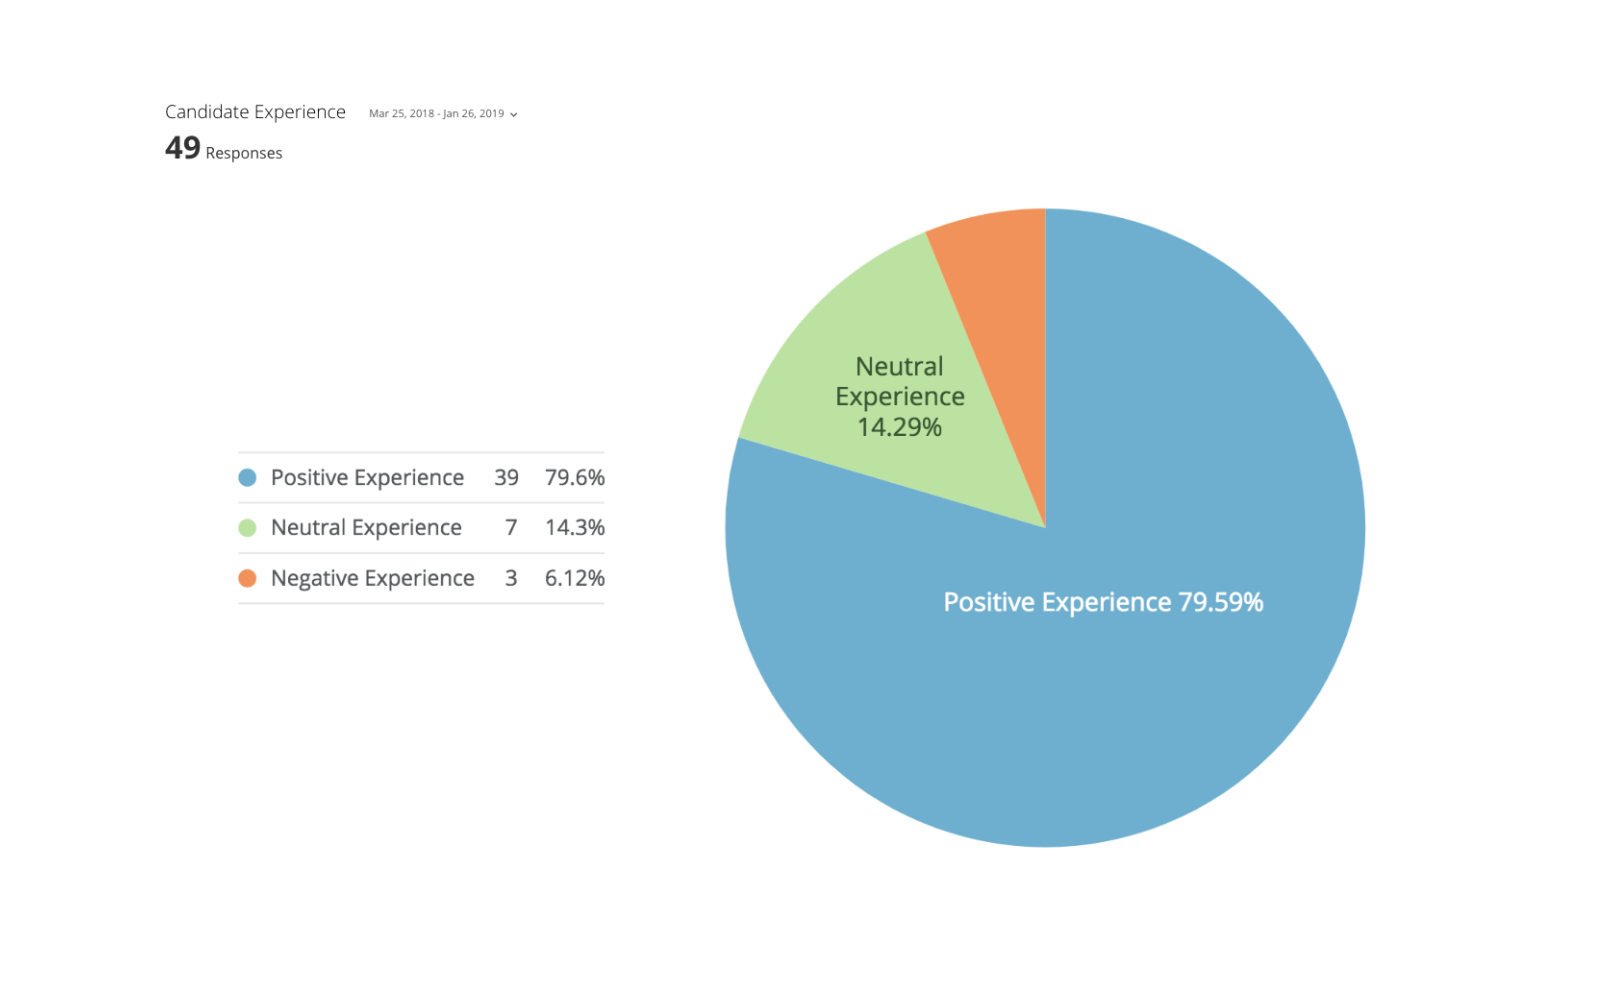
We drill down into each visualization to review any comments the candidate left to get a clearer picture.
Some survey respondents felt our Super Days were too long. We never want to turn off qualified candidates, so we capped our on-site interviews at four hours.
We also send handwritten notes to every person who comes onsite because we understand it’s a commitment to join us for half a day and we truly appreciate it. It’s these small touches that can entice top talent to accept a job offer—and it sets the tone for how we’ll continue to treat them after they sign on.
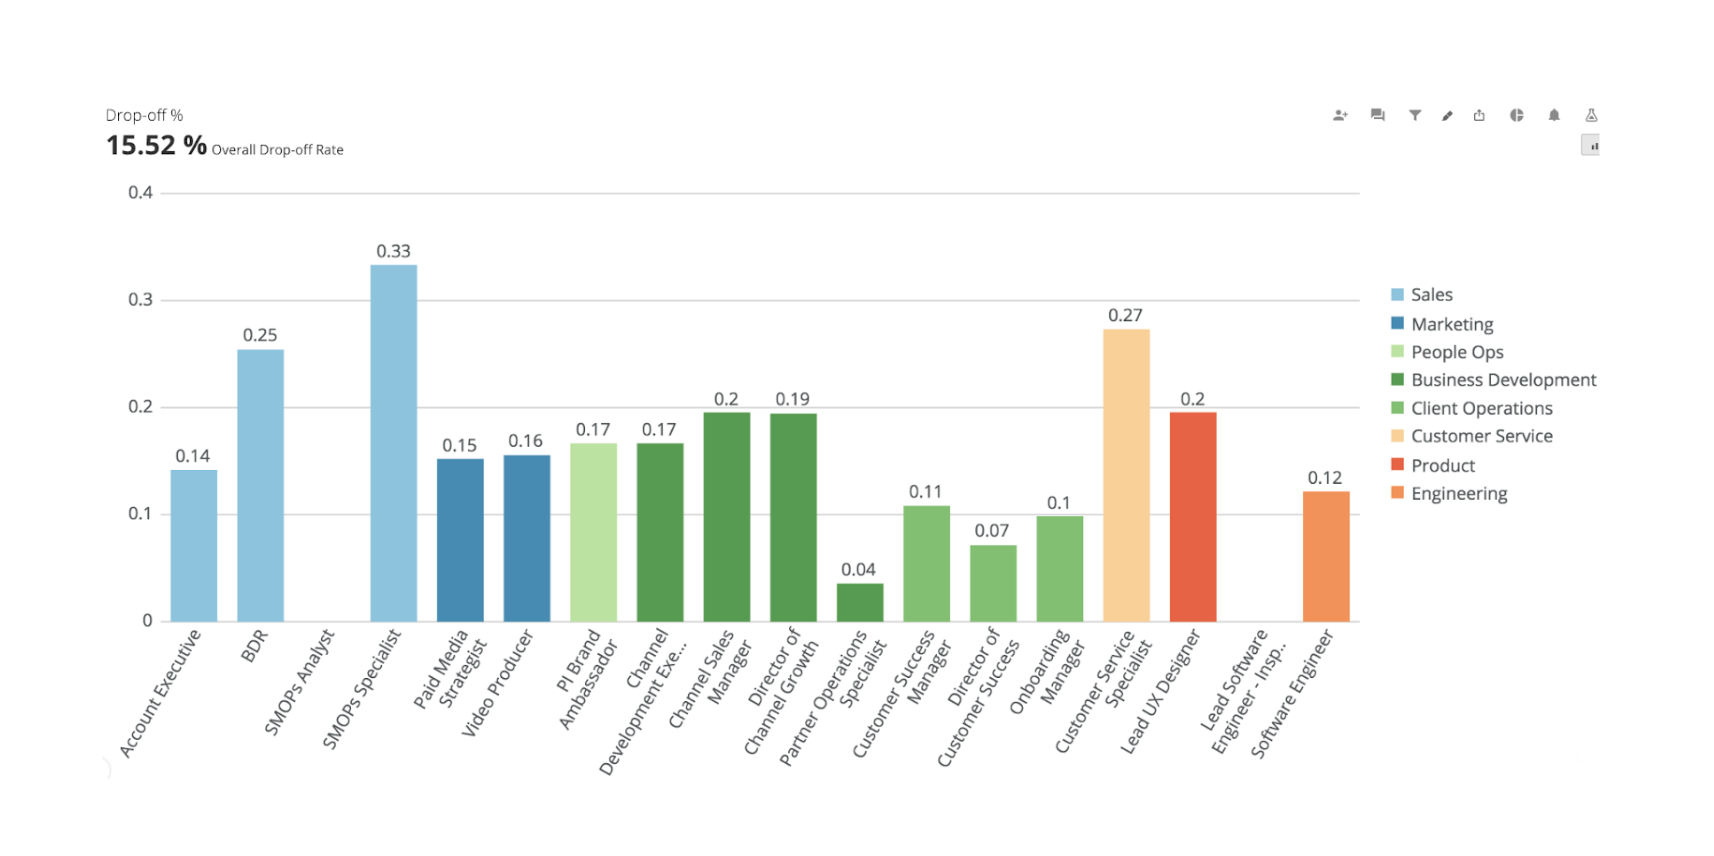
2. Assessment drop-off rate
Another important metric we’ve been tracking is our assessment drop-off rate. Our behavioral and cognitive assessments are part of the hiring process for every candidate that comes through our pipeline. That’s because we want to make sure each candidate is a good fit behaviorally and cognitively before we schedule any interviews. This allows us to spend our time speaking with people we already know with fit in these two areas.
As you can see (below), our average drop-off rate is 15.5%.
Why are we tracking this recruitment metric? We want to make sure we do whatever we can to get that drop-off number as low as possible. We go through our candidate rejection reasons and label those who don’t complete our assessments as one of the following:
- Did not take cognitive assessment
- Did not take behavioral assessment
- Did not take either assessment
This lets us get granular by specifying what type of assessment it is that they aren’t completing. To go a step further, we break it down by position and department so we can make changes based on specific teams and roles as needed.
When we started tracking this metric, we had an 18% drop-off rate. Not bad! But we’re always striving to improve, so we thought about what we could do to bring that even lower.
Join 10,000 companies solving the most complex people problems with PI.
Hire the right people, inspire their best work, design dream teams, and sustain engagement for the long haul.
Our first thought was to tweak the language we use when asking candidates to complete assessments. With the help of some folks on our marketing team, we were able to make the email communication shorter and explain why we were asking them to take our assessments. We monitored the data over the next month and saw our drop-off rate go down to 15.5%.
We’re continuing to play with our method and process to see what works and what doesn’t so we can get that number as close to 0% as possible.
More useful recruitment metrics to track
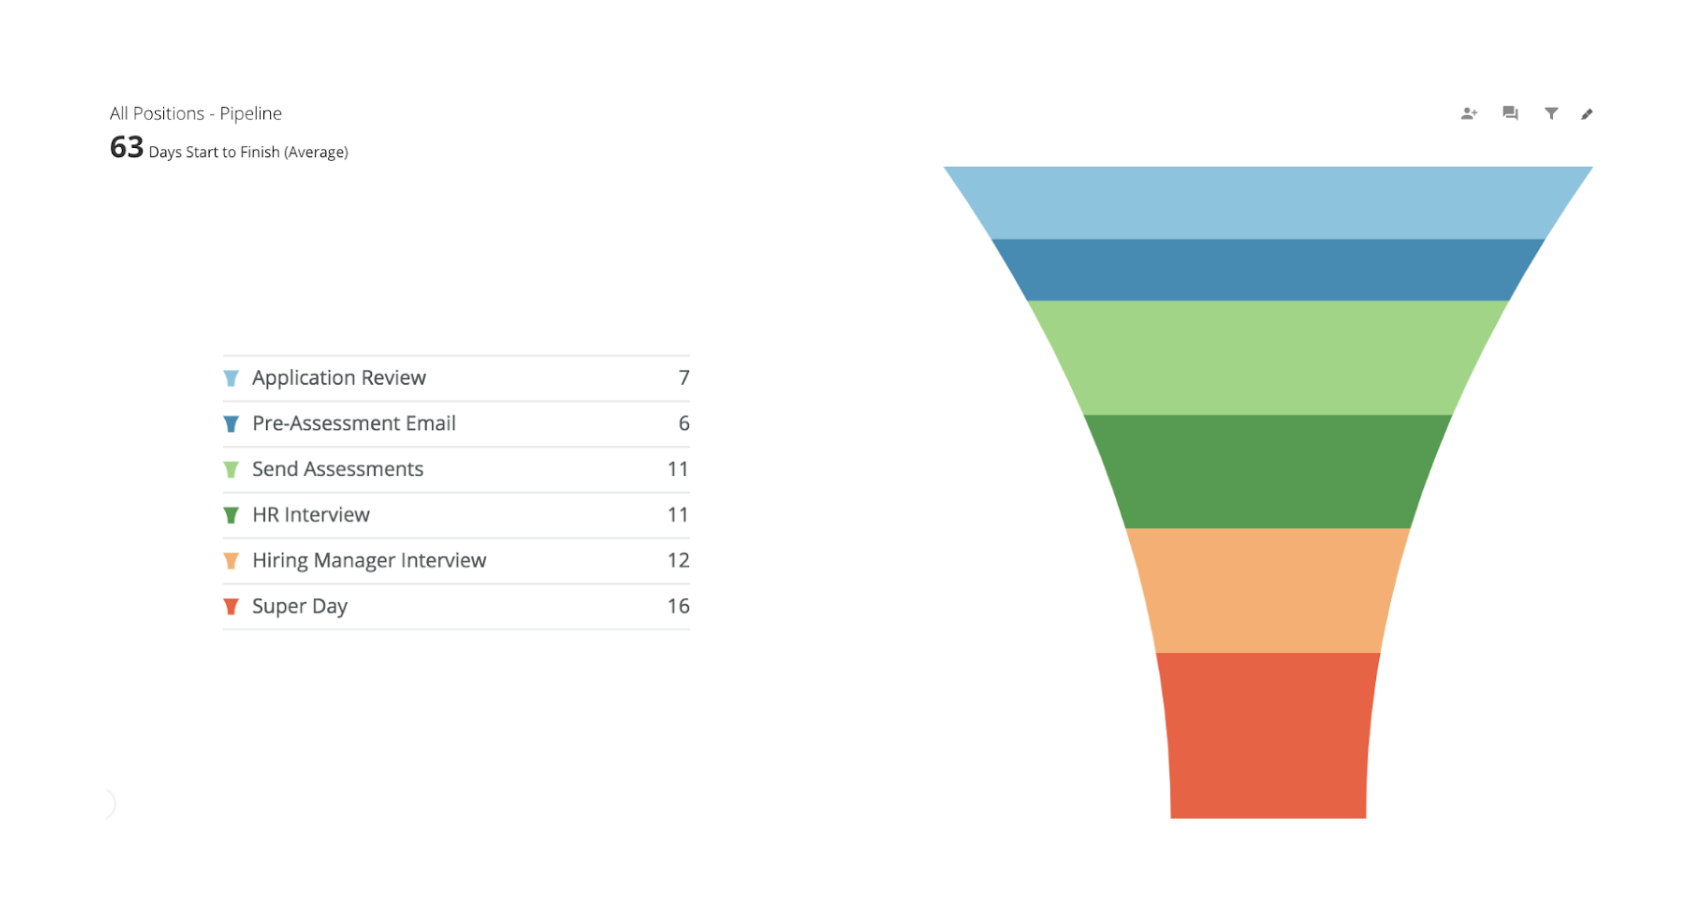
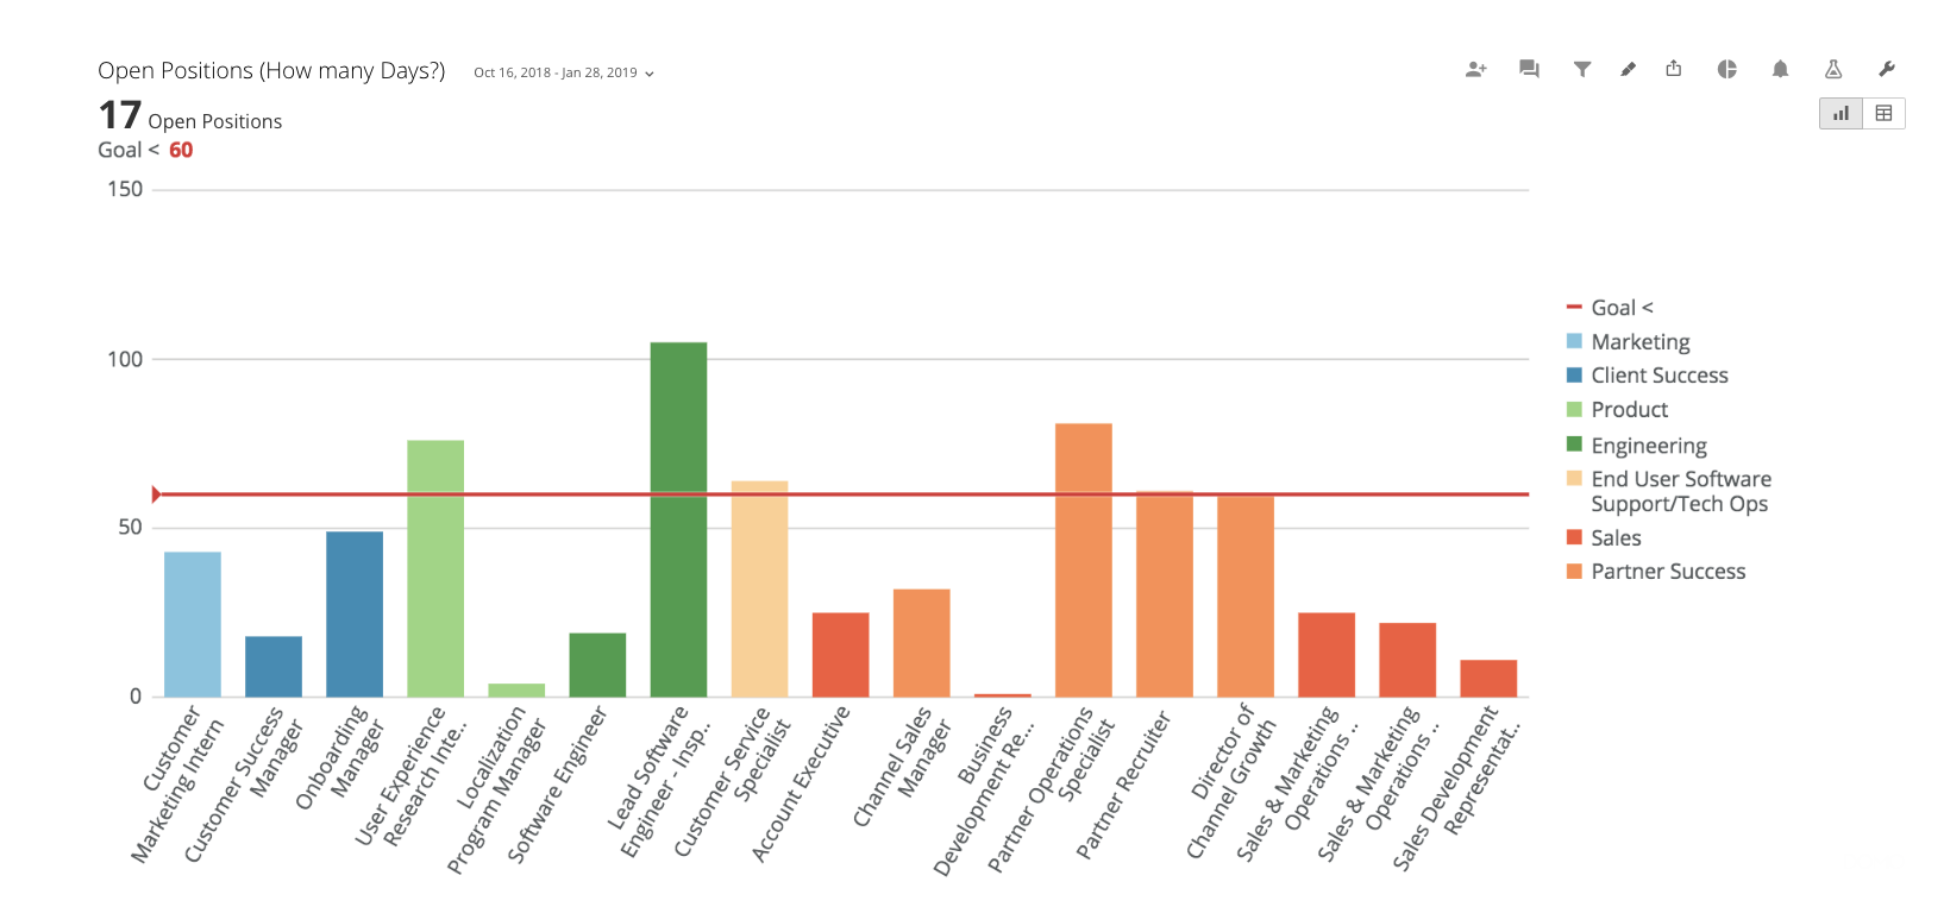
A few more useful metrics we track are time to fill and open positions. These help us see what positions have been open, how long they’ve been open, and how long it took us to close the ones we’ve already filled.
It’s nice to see this at an organizational level, but that view doesn’t allow us to pinpoint what’s holding up the process for particular jobs and departments. That’s why we also look at the metric from a position/department level so we can work with each team individually, identify bottlenecks in the interview process, and test new methods to bring the number down.
Lessons learned
When you start digging through data, you’ll oftentimes find that folks will come to you with requests to see the numbers on a certain topic. My best advice here is to always ask “why do you want to see that?” or “what do you plan on doing with the data?”
It’s a simple question to help both sides better understand what people are trying to learn from seeing certain pieces of data. Some things might be “cool to see,” but they won’t actually help make the organization better. If people don’t really know why they want to see data or what they could do with it, it might not be worth digging into. On the other hand, when someone paints a clear picture of what they’re hoping to get out of the data, we’re able to dive right in and get the data they need so they can use it to tell a story. Asking “why?” will go a long way for everyone!
One last quick tip: Start small. Don’t go changing everything all at once. You won’t be able to track the reasons why things change if you do that. Start by making minor tweaks to your process and see if the numbers improve. If they do, you’ll know why.